
In a world beset by geopolitical tensions, trade disputes, and economic uncertainty, equity markets have continued to surprise on the upside. For South African investors, the post-“Liberation Day” rally has revealed a hidden strength in local equities that defies the broader narrative of emerging market vulnerability. While global headlines have been dominated by tariff threats, war-driven commodity fluctuations, and the resilience of US markets, South Africa’s bourse has quietly delivered exceptional returns.
Since the 2nd of April, now dubbed “Liberation Day”, the local and global equity markets have handled the turmoil like a champ. Despite, ongoing wars, oil price concerns and the renewed threat of steep tariffs from President Trump. The US equity market has continued to remain resilient and even rally since the last round of tariff threats.
The S&P 500 has recovered to record highs once again, with a return of about 24% since the bottom of the drop. Meanwhile, the VIX has recovered to normal levels, signalling positive investor sentiment post April. The recovery was mainly driven by rallies in the tech and industrial sectors.
The South African equity market also performed impressively in the period, reaching all-time highs of its own, returning around 19% since Trump’s tariff turmoil began. Combined with the relative strengthening of the rand to the dollar, this has allowed the JSE All Share index to outperform the S&P500 over the last 5 years in dollar returns.
Figure 1: Total Return Index
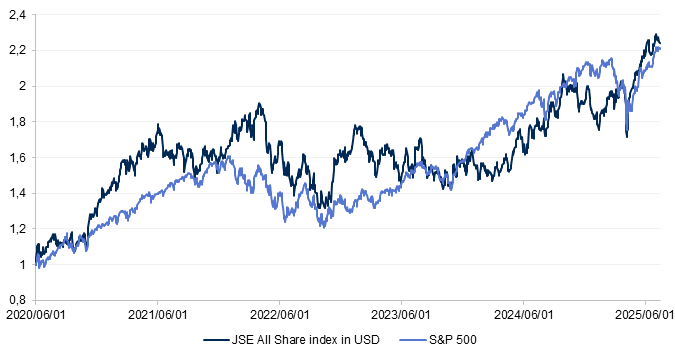
This outcome is particularly striking considering the strong US equity exceptionalism narrative and the global shift towards dollar-based assets over the past decade The performance underscores that, over this period, the JSE All Share Index has been a surprisingly competitive investment option for both global and local investors!
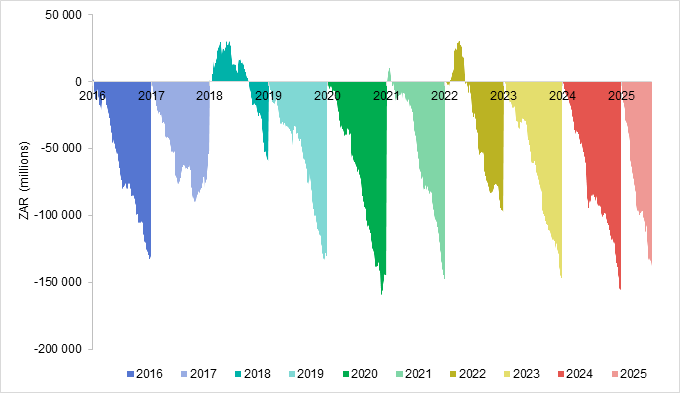
However, despite these strong returns, foreign investors have remained persistent net sellers of South African equities, with nearly R150 billions in net outflows recorded so far this year. This trend underscores that the main beneficiaries of the market’s strong performance have been local and foreign investors who chose to stay, rather than new foreign capital inflows.
Figure 2: SA equity sales to foreigners per year
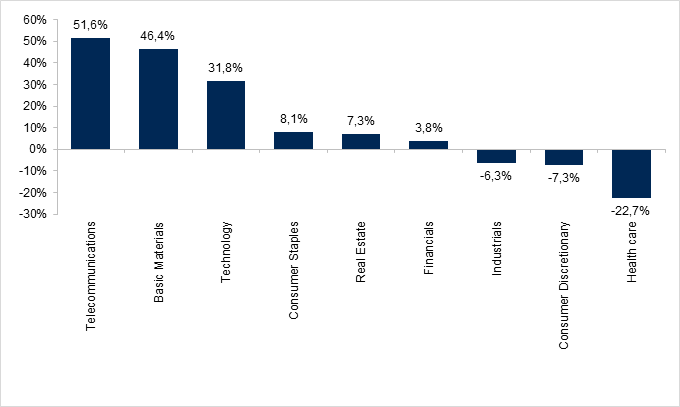
A major driver behind the stellar year-to-date performance has been the basic materials sector, notably gold miners, who have benefited from a roughly 28% increase in the gold price so far this year. The basic materials sector now accounts for about 21% of the All Share Index, only a few percentage points behind the financial sector’s 25% weighting. Meanwhile, the telecommunications and technology sectors have also delivered impressive gains, adding to the market’s broad-based rally.
Figure 3: Year to Date SA Sector Performance
Looking ahead, investors will keep a close eye on the 1st of August, the deadline Trump has set for the next round of tariffs. This presents a new potential wave of uncertainty for markets. However, investors can take some comfort in knowing that while tariffs present a once-off upward shock to price levels, they are unlikely to impact long-term inflation expectations. Long-term inflation expectations are a key driver of forward returns for all asset classes, including bonds and equities. This component of the forward returns should therefore remain largely unchanged by tariffs even if they do come into effect.
*Image by nico_blue from Getty Images Signature
Disclaimer:
Prescient Investment Management (Pty) Ltd is an authorised Financial Services Provider (FSP 612). No action should be taken on the basis of this information without first seeking independent professional advice.
Please note that there are risks involved in buying or selling a financial product, and past performance of a financial product is not necessarily a guide to future performance. The value of financial products can increase as well as decrease over time, depending on the value of the underlying securities and market conditions. There is no guarantee in respect of capital or returns in a portfolio.
The information contained herein is provided for general information purposes only. The information and does not constitute or form part of any offer to issue or sell or any solicitation of any offer to subscribe for or purchase any particular investments. Opinions and views expressed in this document may be changed without notice at any time after publication and are, unless otherwise stated, those of the author and all rights are reserved. The information contained herein may contain proprietary information. The content of any document released or posted by Prescient is for information purposes only and is protected by copy right laws. We therefore disclaim any liability for any loss, liability, damage (whether direct or consequential) or expense of any nature whatsoever which may be suffered as a result of or which may be attributable directly or indirectly to the use of or reliance upon the information. For more information, visit www.prescient.co.za