
As with all investments, performance helps to pique investors’ interest, and hedge funds are no different. As we see in this article, hedge fund performance has been sound and favourably comparable to long-only investment strategies. This undoubtedly has helped with the increased investment in Retail Investor Hedge Funds.
Performance is the key concern for investors
The first two tiers of the ASISA classification enables financial planners and investors to be clear firstly, on what regulatory structure they are investing in, with the Retail Investor Hedge Funds having significantly more guardrails than the Qualified Investor Hedge Funds, and secondly, knowing (to a certain extent) what geographical exposure they are getting. But inevitably, the rubber hits the road with investments when one looks at their performance.
Ultimately financial planners will be judged not on what type of fund or geographical exposure their client gets invested in, but rather on what returns were generated by their investment.
When looking at returns from hedge fund investments, the overriding observation has to be that not all hedge funds are made equal. We already know this is the case from the third tier of the ASISA classification standard, which is based on the manager’s self-classification according to the objectives of the investment strategy.
This classification is based on whether or not a CIS RIHF portfolio or CIS QIHF portfolio has a prior track record and has been classified in a published survey. If so, the category in which they have been published will be considered and any deviation from this will need to be justified by the manager.
There are four broad categories at this third tier of classification.
1) Long-Short Equity Hedge Funds
These funds predominantly generate their returns from positions in the equity market, regardless of the specific strategy employed. There are two broad strategies they employ, the long-short equity strategy and the market neutral strategy.
Long-Short Equity
This strategy aims to generate positive returns by taking both long and short positions in the equity market, thereby reducing market risk while retaining company-specific risk. The goal of a long-short equity strategy is to minimise overall market exposure while profiting from gains in the long positions and price declines in the short positions.
Within the long-short strategy, fund managers tend to adopt one of three approaches:
I. Equity Long-Short – Long Bias – which is the most dominant strategy used by South African managers
II. Equity Long-Short – Short Bias
III. Equity Long-Short – Variable Bias
Market Neutral
When adopting a market neutral strategy, a fund manager takes similarly sized long and short positions within related equity sectors to offset directional market risk. The goal is to generate profit from both rising and falling prices. This strategy is often achieved by holding matching long and short positions in different stocks, allowing the fund to capitalise on mispricing.
2) Fixed Income Hedge Funds
These funds use interest rate sensitivities to generate investment returns by capitalising on arbitrage opportunities in interest rate securities. This strategy uses various techniques such as basis trading (eg cash vs futures), yield-curve arbitrage, credit spread trading and volatility arbitrage in fixed income markets. The goal is to generate returns while hedging against significant interest rate risk, typically through matched long and short positions in related securities.
3) Multi-Strategy Hedge Funds
These funds do not rely on a single asset class to generate investment opportunities but rather blend a variety of different strategies and asset classes with no single asset class dominating over time. By combining approaches such as equity long-short, credit arbitrage, macro and statistical arbitrage, the fund aims to achieve diversified, risk-adjusted returns. This flexible approach allows the manager to adapt to different market conditions and capitalise on opportunities across various strategies.
4) Other hedge funds
These are portfolios that have a very specific strategy that does not fit into any of the other classification groupings. Some of the strategies that may fall into this category include:
Statistical arbitrage
This uses quantitative models and statistical techniques to identify market inefficiencies and establish short-term positions across a broad universe of securities. By analysing historical data, price patterns and correlations, statistical arbitrage seeks to profit from price movements that deviate from historical relationships or expected trends.
Volatility arbitrage
This aims to capitalise on discrepancies between the implied volatility of an option (or other derivative) and the expected, or realised, volatility of the underlying asset. The strategy often takes positions in options or derivatives where the trader believes the market has mispriced future volatility, seeking to profit from volatility-driven price differences, regardless of the directional movement of the underlying assets.
Commodities
These are funds that predominantly invest in soft or hard commodities. These funds can follow several different strategies to obtain returns that beat their benchmarks from this asset class, including trend following or non-directional market neutral strategies.
The most recent indication of the extent to which each of the strategies are used in the South African hedge fund industry is provided by data from the 2024 Novare Annual Survey in which over 60 hedge fund managers participated.
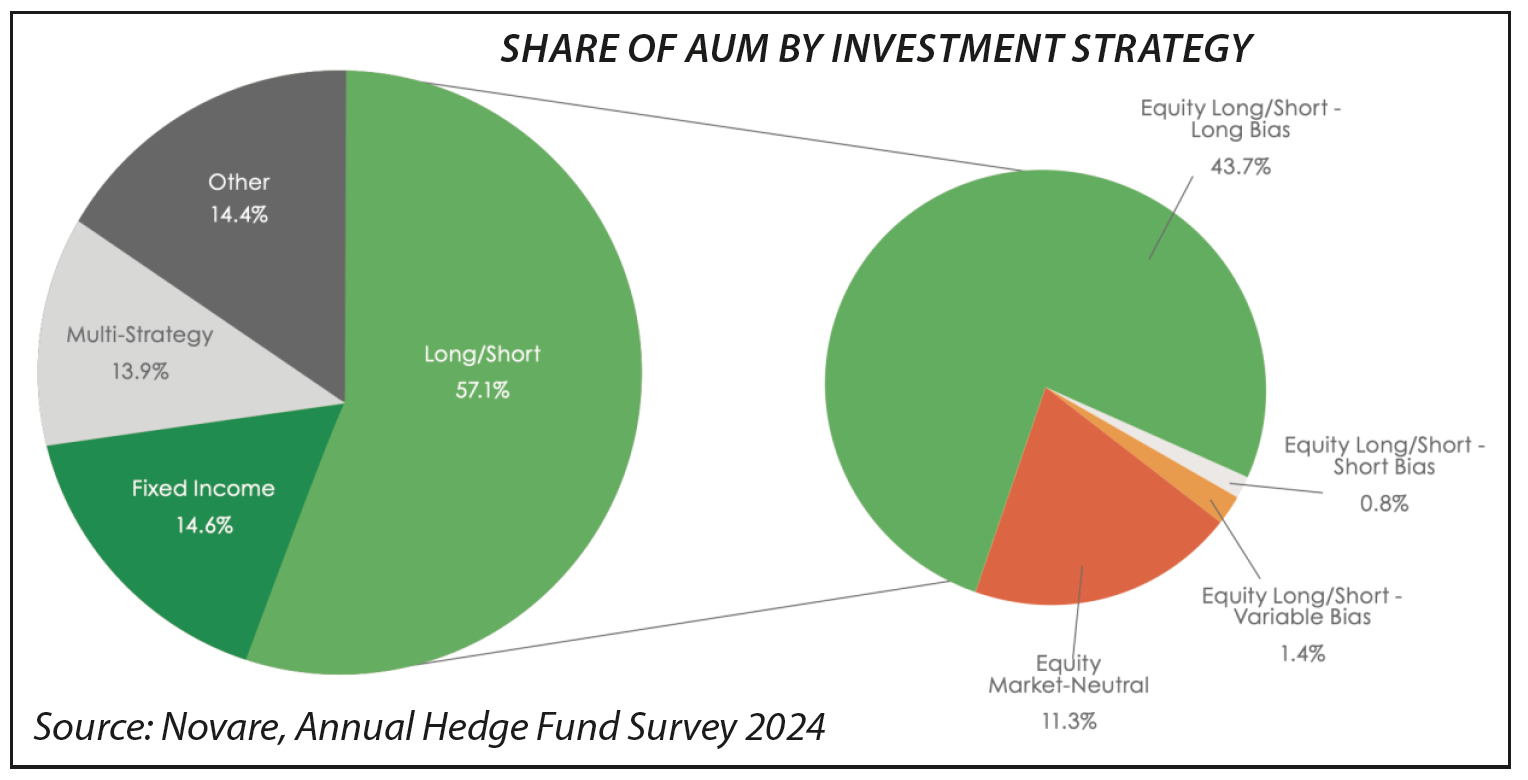
From this survey, as shown in the graphic below, Long-Short strategies dominate the assets being managed by hedge funds, with 57.1% share, with the other three strategy types managing similar levels of assets: Fixed Income 14.6%; Multi-Strategy 13.9% and Other 14.4%. Within the Long-Short Equity category, the Equity Long-Short – Long Bias dominates as it makes up 76.5% of the Long-Short strategies, followed by Market Neutral strategies making up 19.7% of the strategies, followed by the Equity Long-Short – Variable Bias with 2.4% and Equity Long-Short – Short Bias making up 1.4%.
While the third tier of classification may be helpful to financial planners and investors to decide what type of hedge fund they wish to invest into, the investment outcomes that can be experienced within each type of strategy (intra-strategy) are almost as varied as the outcomes which can be experienced between the different strategy types (inter-strategy). The potential range of returns generated by the different fund types highlights how important it is for financial planners and investors to do in-depth research before investing. The extent of the range of returns that hedge funds can deliver is demonstrated by a performance review of each of the different tier-three fund types to the end of 2025.
The performance review outlined in this section is based on data sourced from HedgeNews Africa and it is not a universal review of all hedge funds available to investors. Nevertheless, it is indicative of the nature of returns which different types of hedge funds have delivered over one year, three years and five years to the end of 2025. In addition, it shows the average annual returns generated by funds since their inception.
Performance is always risky to review and compare because each fund has a unique mandate and inception date. Nevertheless, performance is important as one of the factors that a financial planner or investor will consider when deciding whether or not to invest in a hedge fund.
This review naturally comes with the disclaimer that past performance is no guarantee of future performance, and that the key consideration for an investor is to understand what has generated the performance of a particular fund, and what is the prospect for that to be repeatable. While exploring the drivers of performance in particular funds is not the remit of this guide, it is useful to look at how wide-ranging returns can be within a particular strategy, as well as between different types of strategies.
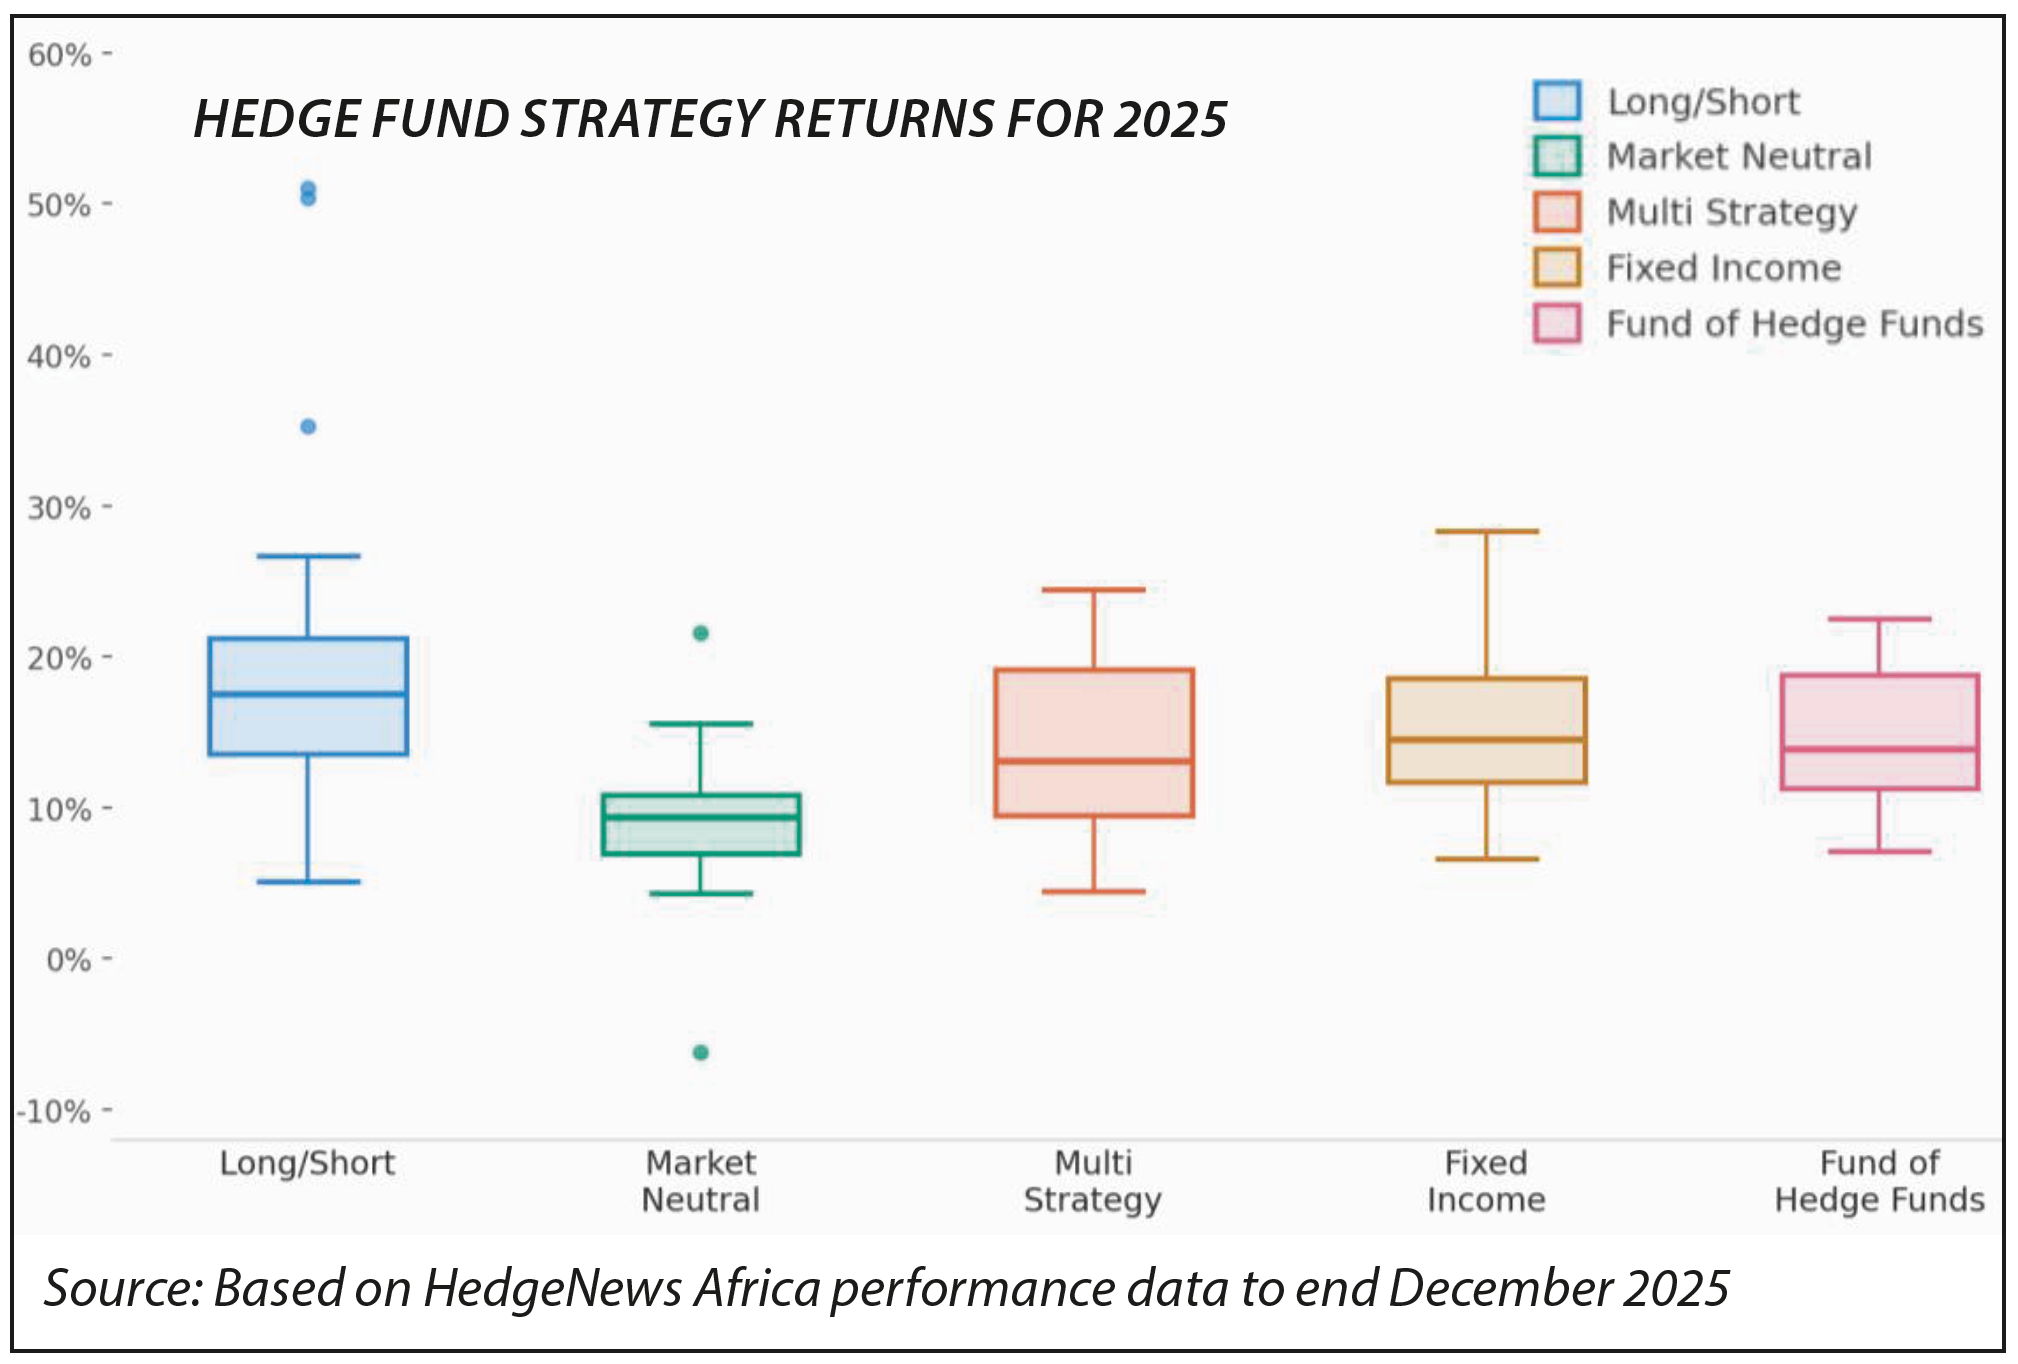
This can be clearly seen in the graphic below which shows returns for selected hedge fund strategies for the 12 months to the end of 2025.
In the Long-Short and Market Neutral strategies there are clear outliers on both the upside and downside of performance. However, what is notable across all the strategies is that the downside of each strategy is limited and stable.
Apart from the outlier with a -6% return, the lowest-returning funds in each strategy type returned in the relatively narrow range of 4% to 7%, which highlights one of the significant benefits of including hedge funds in a portfolio, namely to stabilise returns in the short term to facilitate a smoother investment journey over the longer term. Despite this consistency on the downside in the short term, it is interesting to note that there is a significant dispersion of returns across funds within a strategy type.
SA Long-Short Equity
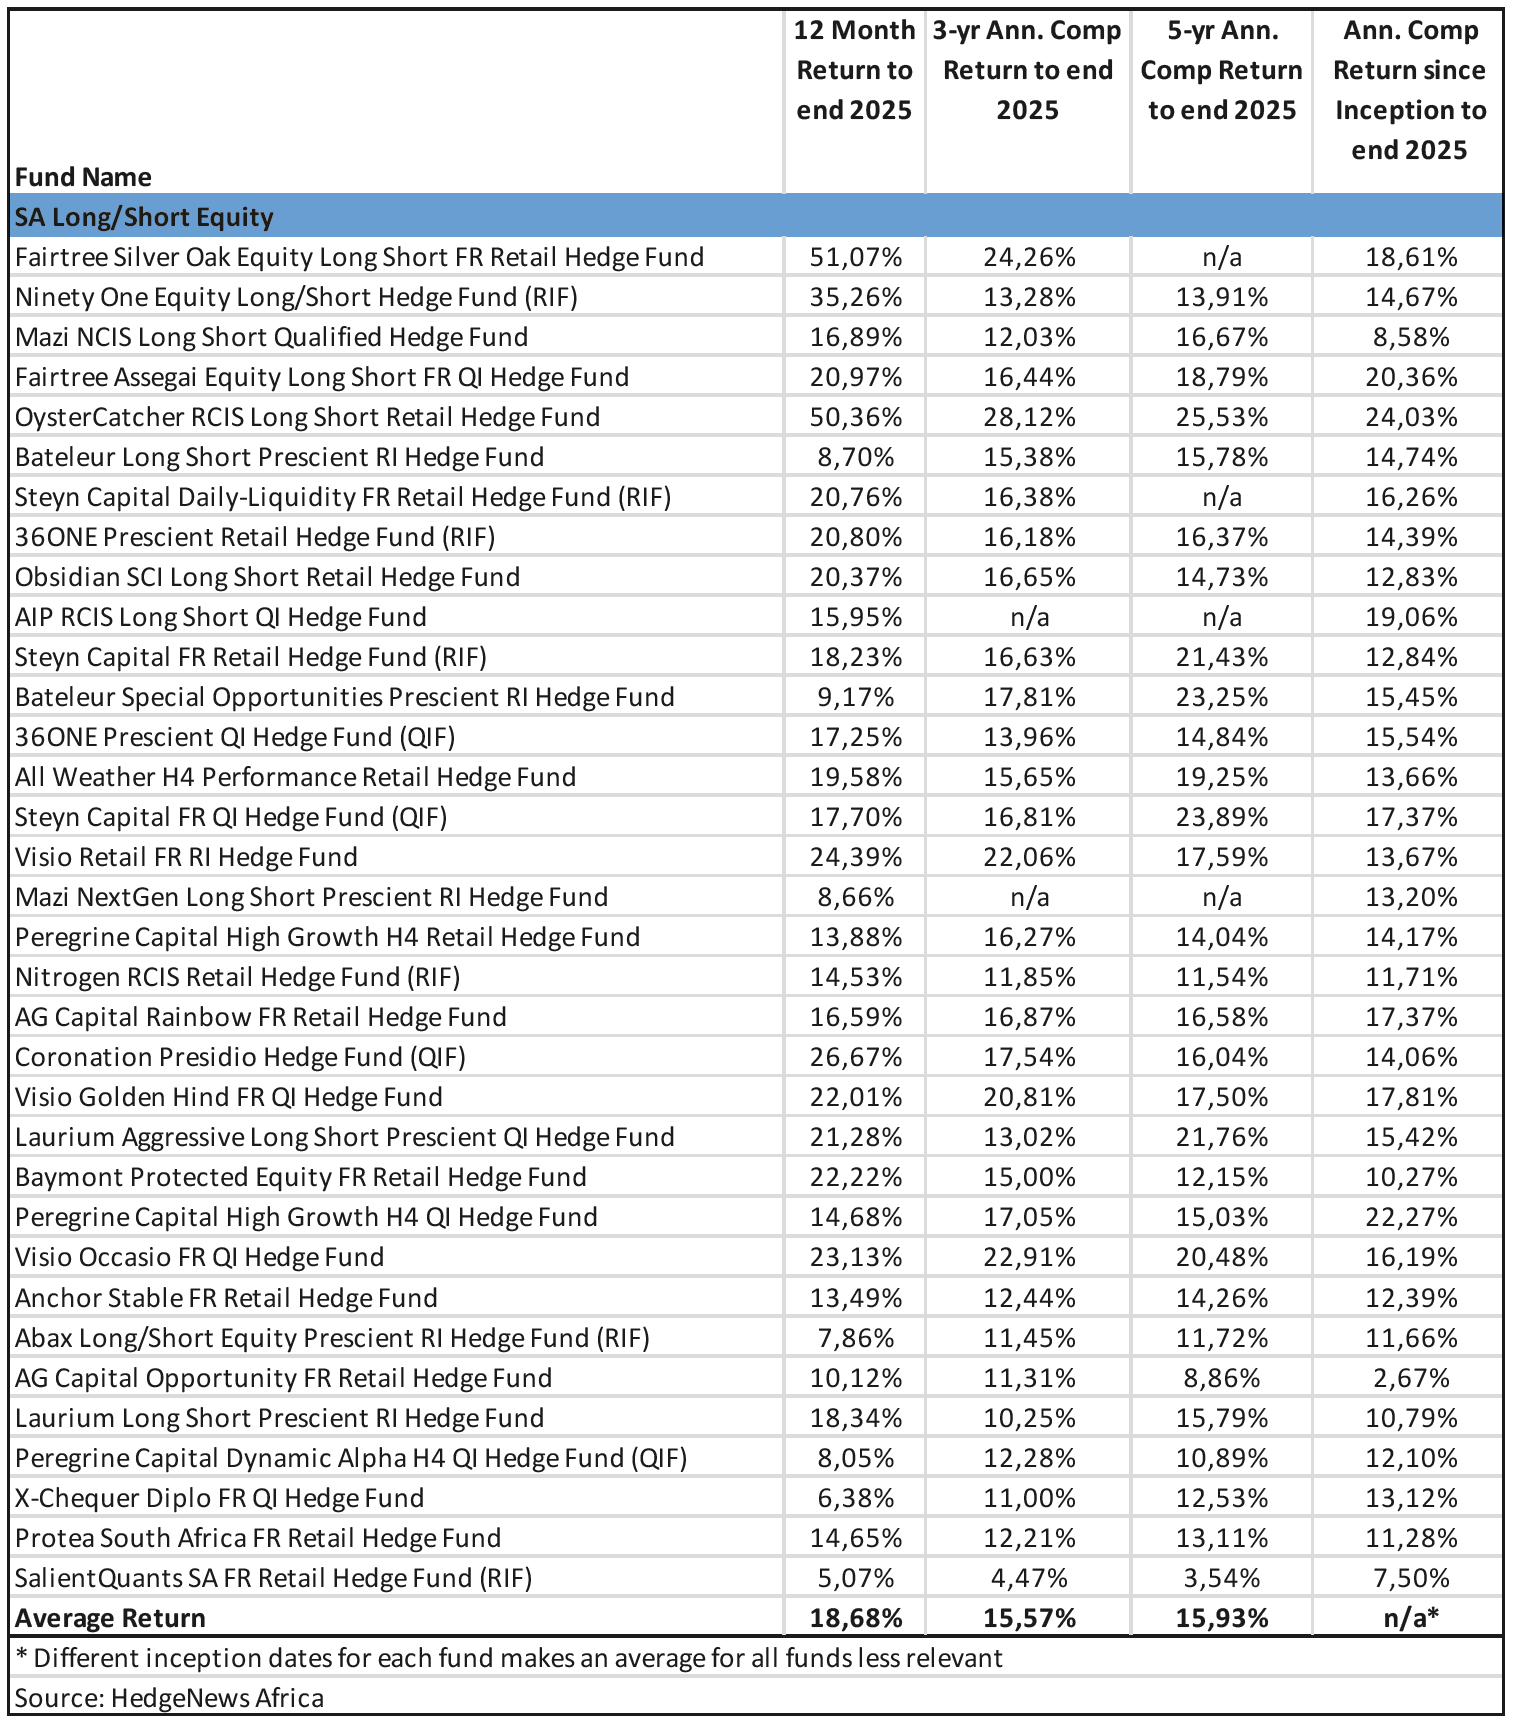
Given the variable approaches that managers can adopt in the Long-Short Equity category – with either long bias, short bias or variable bias – it is no surprise that for the calendar year of 2025, the range of returns was very wide, with the top-performing fund generating a return of 51.07%, followed closely by the second fund which delivered 50.36%, with the fund in third place returning 35.26%. At the other end of the scale, the bottom fund delivered 5.07%, only slightly less than the second-bottom fund which produced 6.38% for the year.
The contrast in performance will be in part due to the skill of the managers, but also influenced by the mandate of the fund, which can vary significantly in the Long-Short fund category. Given the very strong performance of the JSE in 2025, up 42.4% for the year, the funds with a long bias would undoubtedly have benefitted from the strength of the equity market.
Of the 34 funds reviewed in this category over 12 months (see table below), 13 (38%) delivered a return of 20% or more for the year, while seven funds (21%) generated a return of less than 10%. The remaining 14 funds (41%) delivered greater than 10% but less than 20% for the year. In contrast, over three years, of 32 funds, only five (16%) of funds delivered over 20% pa with the top performer delivering an annual return of 28.12% pa.
All other funds delivered at least 10% pa barring the lowest-returning fund which delivered only 4.47% pa. The average return of the Long-Short funds over three years was 15.57% pa.
Over five years of 30 funds, again only five funds (15%) delivered over 20% pa with the balance again producing returns above 10% pa apart from the bottom fund which returned 3.54% pa. The average return over five years was 15.97% pa.
Outstanding performance in the hedge fund industry is recognised annually through the HedgeNews Africa Awards which measure the best risk-adjusted returns of funds. Risk-adjusted returns are an important measure for hedge funds in particular because of the inherent nature of hedge funds to “smooth” the journey for investors.
The key measure that is used in these awards to assess a fund’s risk-adjusted performance is the Sharpe Ratio. This ratio is determined by calculating the fund’s excess return over a risk-free rate divided by its standard deviation (volatility).
The importance of this measure is that it helps investors determine if higher returns are due to skill ie making sound investment decisions, or simply excessive risk-taking. The higher the Sharpe Ratio, the better.
On this basis, the Oyster Catcher RCIS Long Short Retail Hedge Fund won the Long/Short Fund of the Year Award with a Sharpe Ratio of 6.7. This even though the top-returning fund in the category was the Fairtree Silver Oak Equity Long Short FR Retail Hedge Fund but it had a lower Sharpe Ratio of 4.6.
The category award goes to the fund with the highest return, provided that the Sharpe Ratio is within 25% of the highest Sharpe Ratio in the category. This can at times lead to some counter-intuitive results where the winning fund’s return is well below that of the highest-return fund in the category. Nevertheless, Fairtree Silver Oak was selected as the overall “Fund of the Year”. This is a separate award chosen from across all funds considering the judges’ overall assessment of the fund’s achievement during the period.
The Fund of the Year is often an extremely high-returning fund that may not have won the category award due to the Sharpe Ratio criteria. As a result, it is possible for one fund to win the specific category award, while another fund from the same category is selected as the overall Fund of the Year.
The nature of these awards is a reminder to financial planners and investors that while ultimately returns are what count when it comes to achieving an investor’s goals, the manner in which those returns are generated is core to the proposition that hedge funds offer investors.
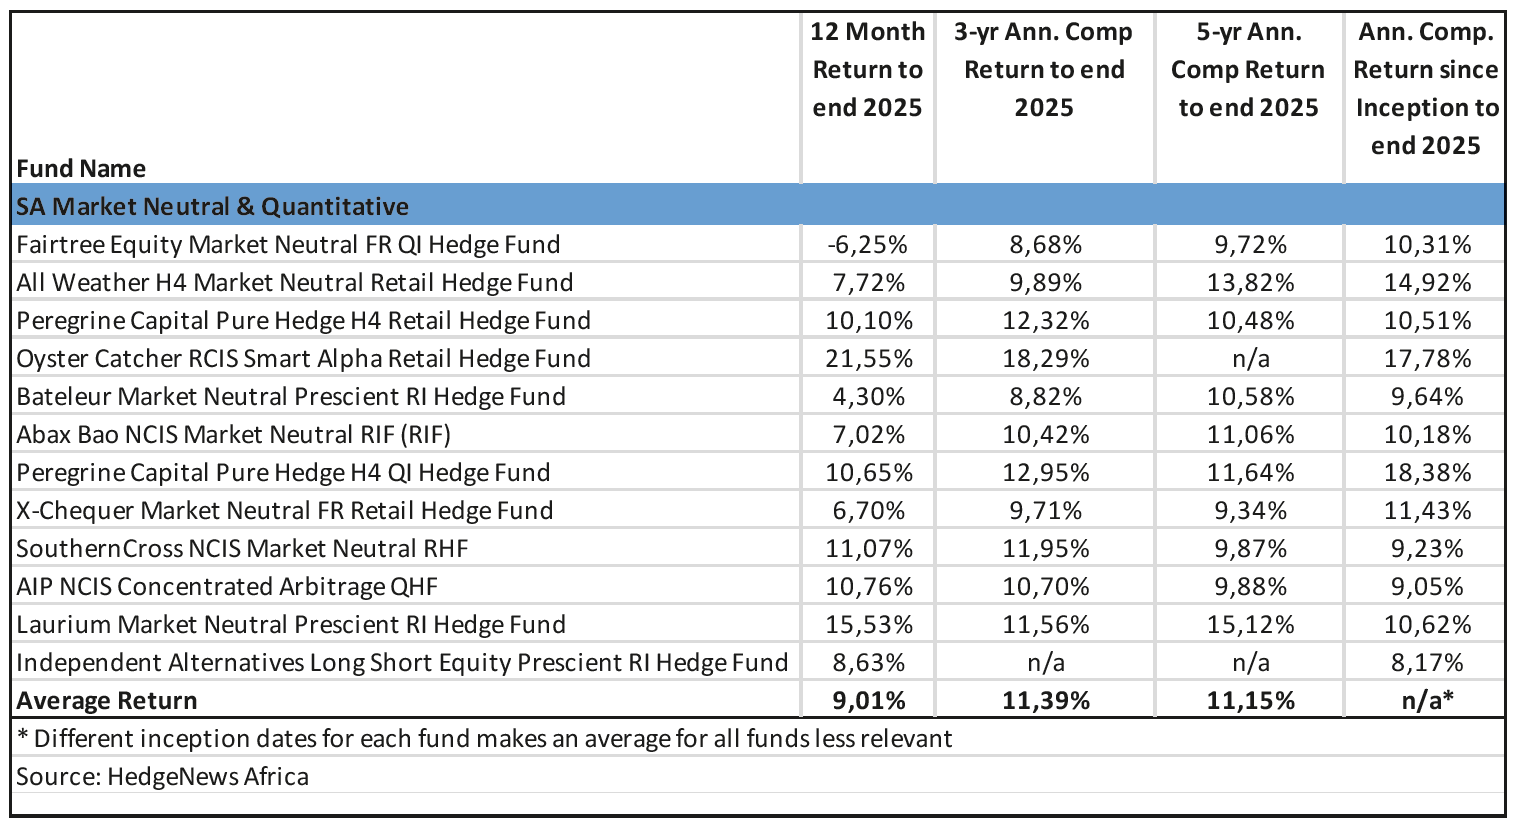
SA Market Neutral
Of the 12 funds reviewed in the Market Neutral category (see table below), in the 12 months to the end of 2025 the Oyster Catcher RCIS Smart Alpha Retail Hedge Fund was the standout performer, the only fund returning greater than 20% with a return of 21.55%. It also won the Fund of the Year in this category with a Sharpe Ratio of 3.3. The next-best performer returned 15.53%.
At the bottom end of the rankings, the lowest-returning fund delivered a negative return of -6.25% with 50% of the funds in this category delivering a return of less than 10% for the year. Over three years the top performer had an annual return of 18.29% pa, with the next-best performer returning 12.95% pa. Of the 11 funds with a three-year track record, four returned less than 10% pa, with the bottom two funds fighting it out for bottom spot with returns of 8.68% pa and 8.82% pa. The average fund return for three years was 11.39% pa.
Over five years, out of the 10 funds, the top performer returned 15.12% pa while 60% of the funds delivered returns above 10% pa, with the average fund return over this period being 11.15% pa.
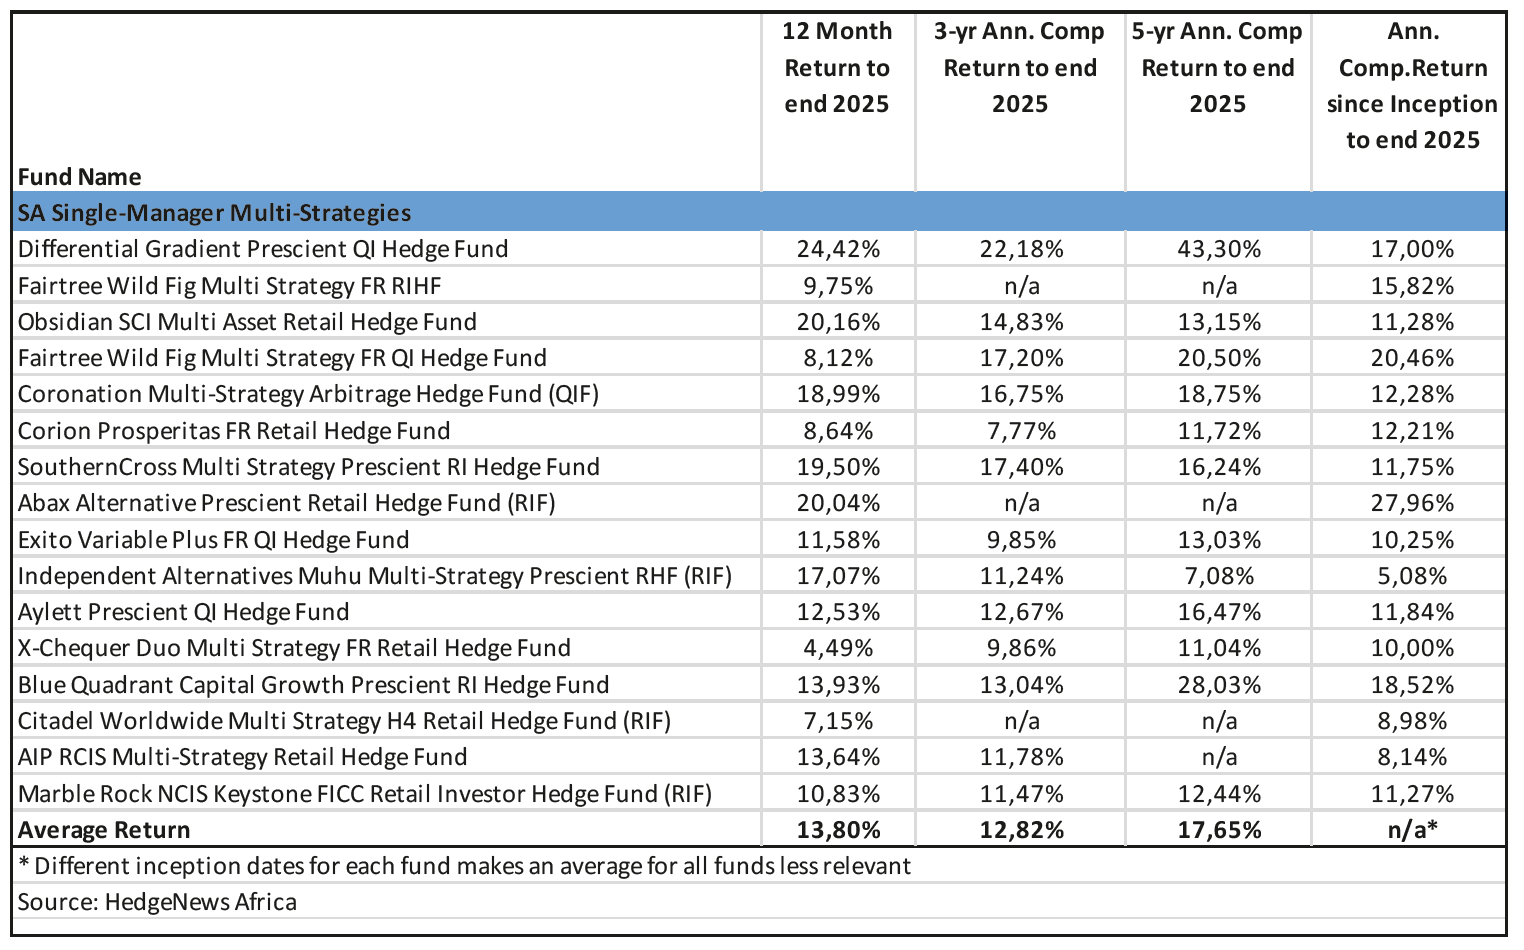
SA Single-Manager Multi-Strategies
Of the 16 funds reviewed in the SA Single-Manager Multi-Strategies (see table below), for the calendar year ending December 2025, the top performer returned 24.42% for the year. This was followed by the runner-up with a return of 20.16% and the fund in third spot returned 20.04%. The importance of risk-adjusted returns is demonstrated by the fact that the second-placed fund, the Obsidian SCI Multi Asset Retail Hedge Fund, was awarded Fund of the Year with a Sharpe Ratio of 2.5.
The bottom-placed fund returned 4.49% with the average fund return for the 12-month period being 13.80%. Over the three years ending December 2025, the top performer returned 22.18% pa making it the only fund able to generate an annual return in excess of 20% for the period. The lowest returner for the period returned 7.77% while the average fund return over three years was 12.82% pa. Over five years the top performer returned 36.32% pa with the second-placed fund returning 28.03% pa. The lowest returner delivered 7.08% pa while the average fund return for the period was 17.06% pa.
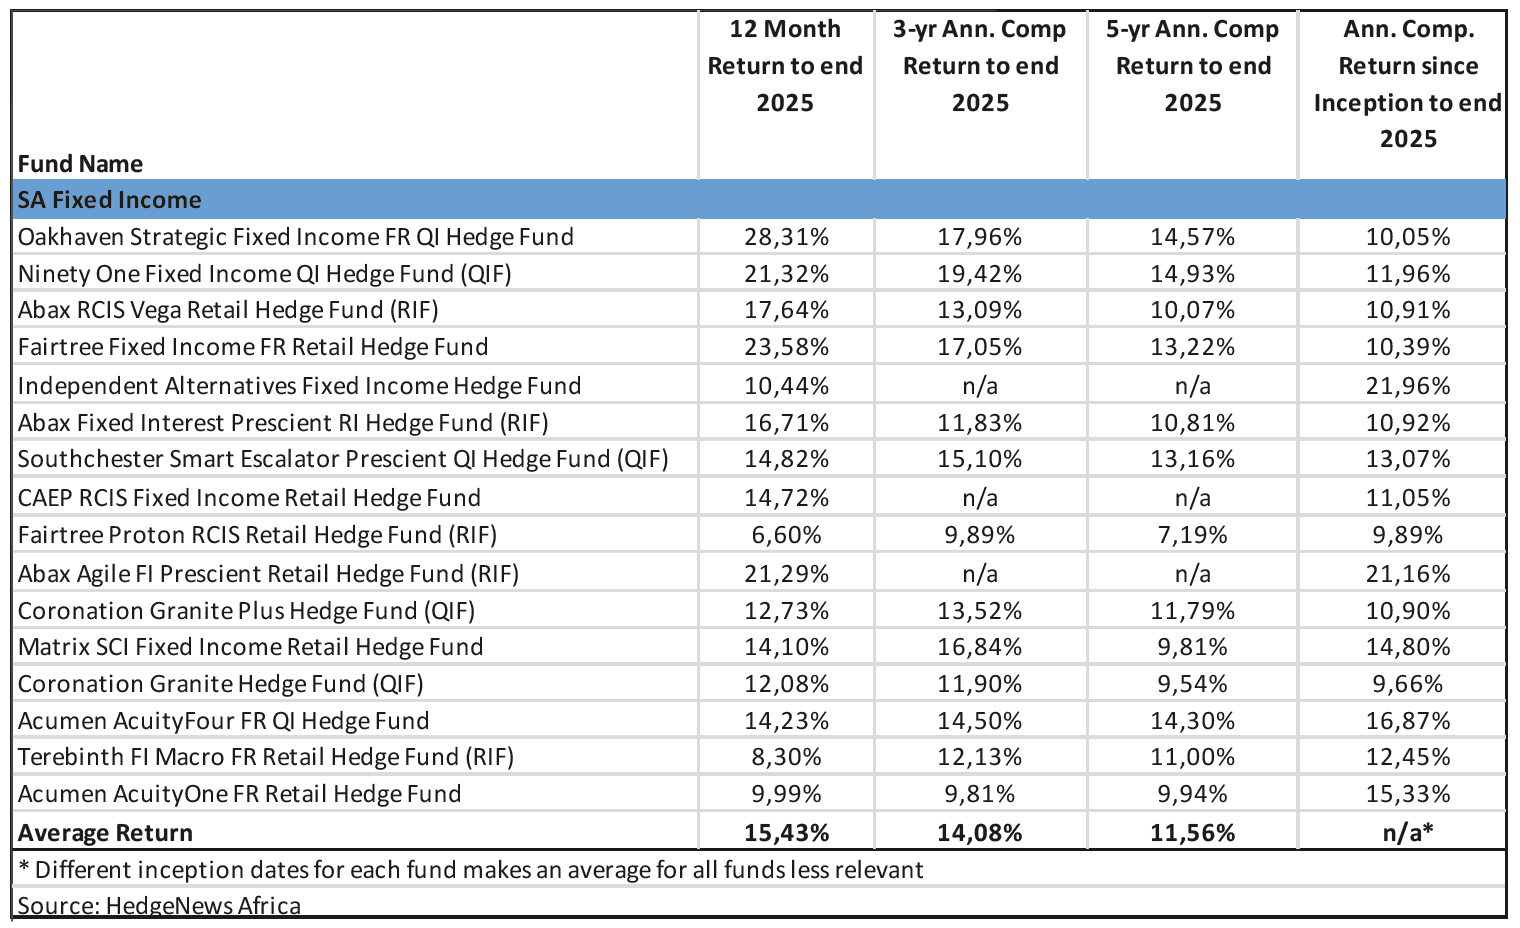
SA Fixed Income
For the calendar year of 2025, of 16 Fixed Income funds reviewed (see table below), the top performer and winner of the Fund of the Year in this category was the Oakhaven Strategic Fixed Income FR QI Hedge Fund with a return of 28.31% and a Sharpe Ratio of 3.13. The second-placed fund returned 23.58% and the third- and fourth-placed funds almost tied, returning 21.32% and 21.29% respectively.
These four funds were the only funds to generate returns in excess of 20%. Three funds generated returns of less than 10% with the lowest returner generating 6.60% for the year. The average fund return for 2025 was 15.43%.
Over three years, the top performer delivered an annual return of 19.42% pa, followed by returns of 17.96% pa and 17.05% pa in second and third place. The lowest returner for the period delivered 9.81% pa while the average fund return was 14.08% pa.
Over five years, the top performer returned 14.93% pa, followed by the second-placed fund delivering 14.57% pa and third place returning 14.30%. The lowest returner for the period returned 7.19% pa while the average fund return was 11.56% pa.
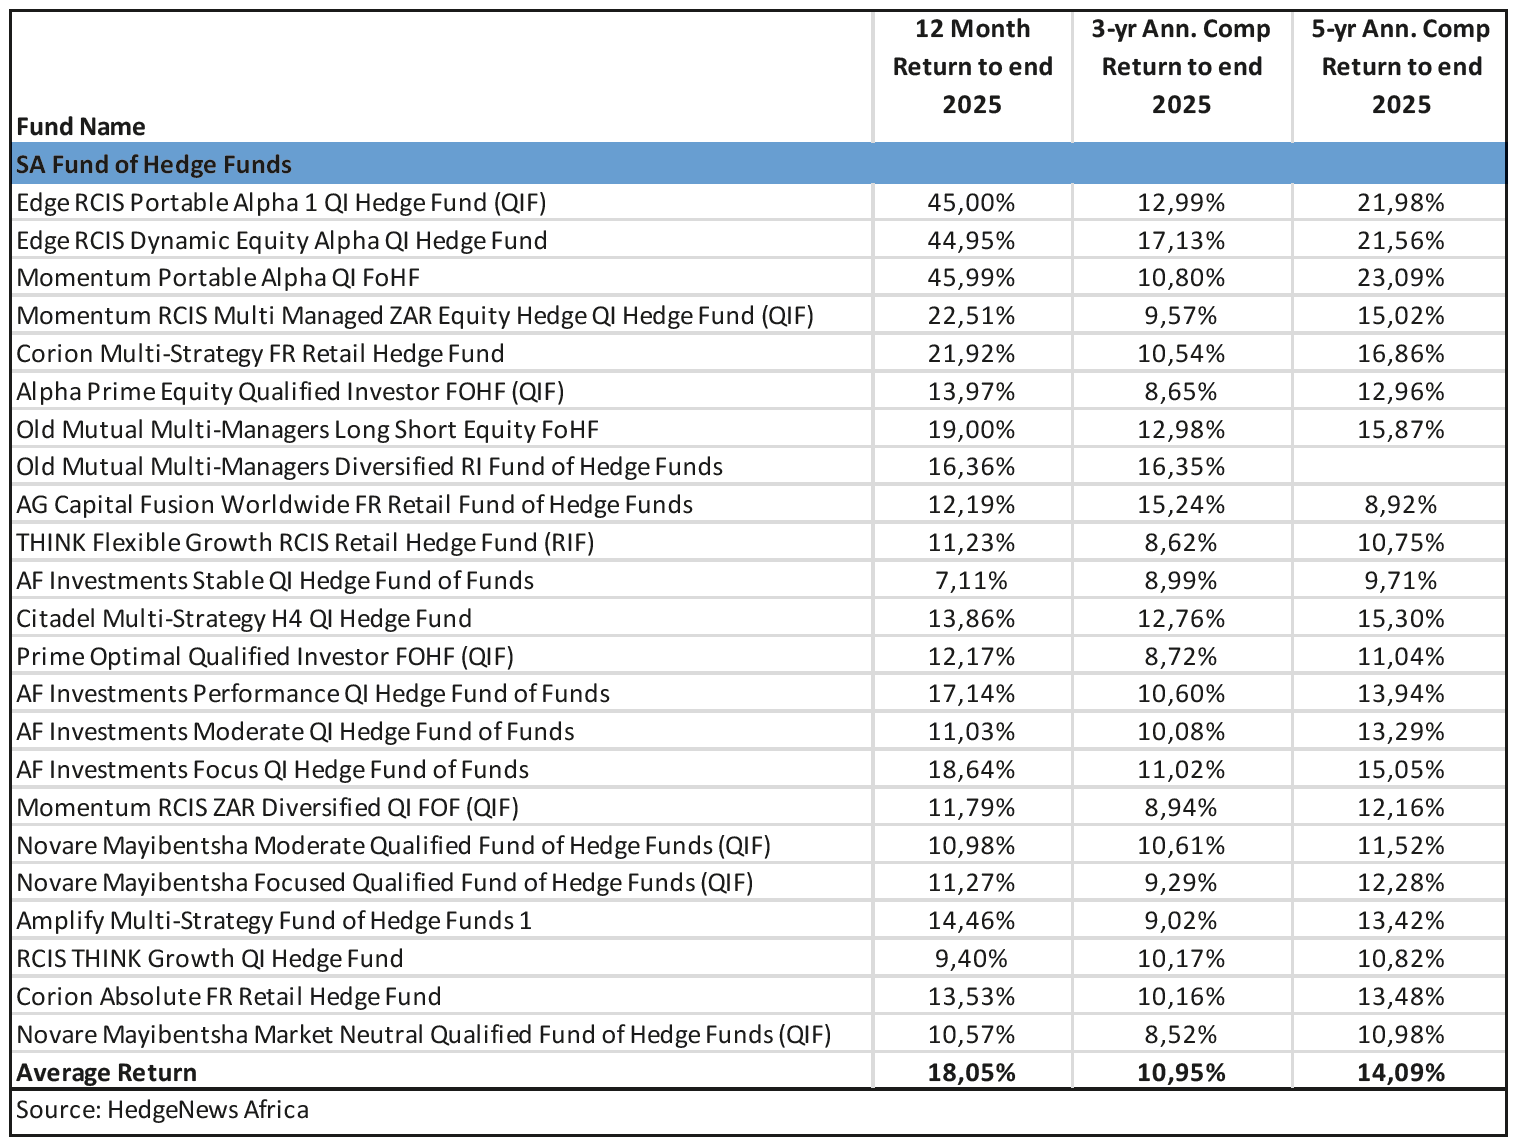
SA Fund of Hedge Funds
Of the 25 Fund of Hedge Funds reviewed (see table below), the top performer for the 12 months to end December 2025 returned 45.99%, followed closely by the second-placed fund (45%) and third place (44.95%). These funds were extreme outliers in the sector with the next-highest returners delivering returns of 22.51% and 21.92% respectively. The lowest returner delivered a return of 7.11% and the average fund return was 18.05%.
Over three years, the top performer returned 17.13% pa followed by returns of 16.35% pa and 15.24% pa from second and third spot respectively.
The lowest returner delivered 8.52% pa but this category is difficult to compare like with like, given that the top performer is labelled “Dynamic Equity Alpha” while the lowest is a “Market Neutral” fund. The average annual return of the funds for the period was 10.95% .
Over five years, the top performer returned 23.09% pa followed by 21.98% pa and 21.56% pa in second and third spots. The lowest returner delivered 8.92% pa and the average annual fund return was 14.09% pa for the period.
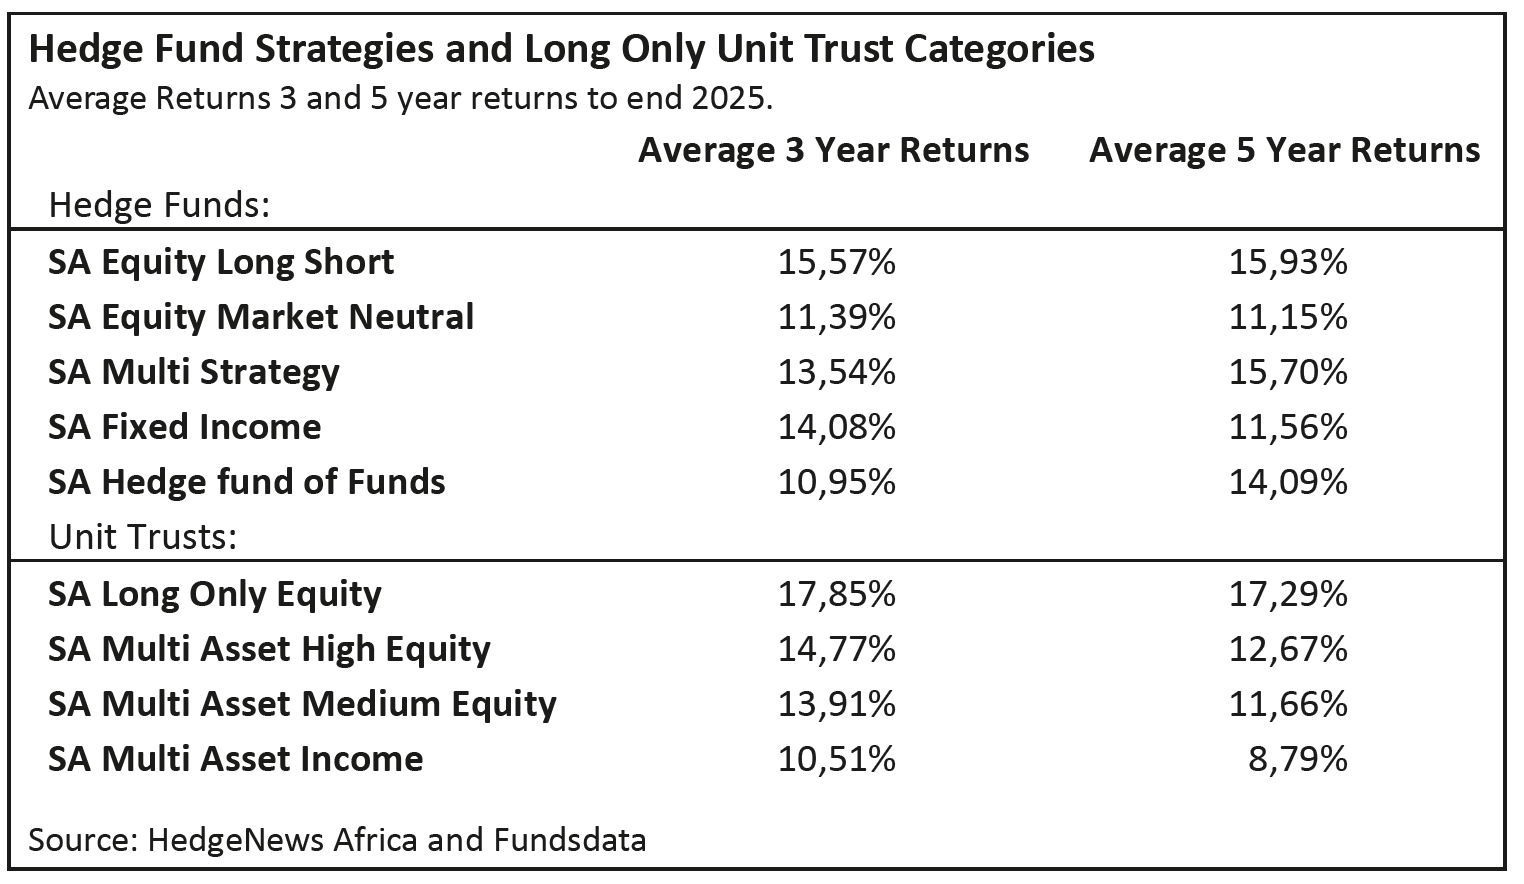
Hedge funds and long-only unit trusts
Given that financial planners and investors are unlikely to use hedge funds exclusively in their portfolios, it is also important to consider the performance of hedge funds against their long-only unit trust counterparts.
As can be seen from the table below, average annual returns of the different types of hedge fund strategies are dispersed in a range of just under 5% pa over three and five years.
Over three and five years, SA Equity Long-Short strategies outperform the other strategies, with average returns of 15.57% pa over three years and 15.93% pa over five years.
While it is not comparing like with like, it is of interest to note that over the period, the average return of the SA Long-Only Equity Unit Trust category outperformed the Equity Long-Short Hedge Funds by just over 2% pa over three years, and just under 1.5% over five years.
Comparing hedge fund performance to long-only performance is important to get a sense check on what each type of approach delivers to investors, bearing in mind that the emphasis on hedge funds delivering risk-adjusted returns is the key measure to consider when deciding whether to use a hedge fund.
The bottom line
It is most important for financial planners and investors to review the performance of a hedge fund against its stated mandate, and to be clear on why they are investing in a particular hedge fund, and what role it plays in their overall portfolio. But performance is only one indicator used to help make an assessment of a hedge fund. The next factor to consider is the one that tends to generate the hottest of debates about hedge funds, namely fees.
* As published in the Blue Chip 2026 Hedge Fund guide.