

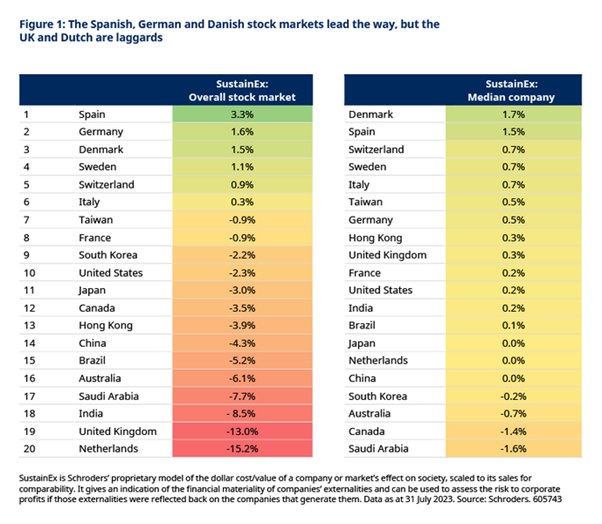
Using a proprietary tool, SustainEx*, which quantifies the dollar-value of the negative and positive effects of individual companies on society, Schroders has ranked the 20 biggest stock markets based on their sustainability credentials.
The Spanish, German, and Danish stock markets lead the way, but the UK and Dutch are laggards. Their differing sector makeups explain why (described below).
We’ve also looked at whether the picture is different for the median company compared with the cumulative total across all companies on each market. It often is. For example, although the UK market ranks low in our league table, around half of UK companies have a positive, unrecognised, effect on society.
This matters but it’s not all that matters
In the past, the negative effects of companies’ activities have been borne by society. But, from carbon pricing to sugar taxes, governments are increasingly reflecting them back on the companies responsible. Companies and consumers are also paying more attention to the behaviour of the companies they choose to do business with.
SustainEx is the tool used by Schroders’ portfolio managers and analysts to assess these risks when making investment decisions. It helps to build up a fuller picture of the risks and opportunities facing individual companies.
But, importantly, sustainability credentials are only one part of the puzzle, and should not be relied on in isolation. Many other factors influence the success or failure of a company, and an investment. When it comes to generating returns for our investors, valuations are key. It is the job of active investors such as ourselves to identify where the market is, and is not, pricing in these risks and opportunities correctly. This applies to sustainability as it does to many other relevant considerations.
The Spanish stock market’s social credentials – and an illustration of how SustainEx works
A figure of 3.3% for the table-topping Spanish market means that, in aggregate, companies listed there have an unrecognised positive effect on society worth 3.3% of their sales.
Putting this in perspective, the consensus forecast is for Spanish corporate profit margins to be 11.3% over the next 12 months. But, if these positive externalities were to crystallise in financial terms, that would rise to 14.6%. In money terms, for every €100 of revenues, earnings would be €14.60, not €11.30, a 29% rise. Not something to ignore.
This does not mean that all companies will be impacted in this way or in this direction. This is our estimate of the potential aggregate impact when all Spanish companies are combined.
An equivalent figure for all other markets is shown in Figure 2. Unlike Spain, the companies on most stock markets have a detrimental effect on the environment and society. A knife would be taken to the corporate profits on most stock markets if the dollar cost of these negative externalities were reflected back onto them.
These figures, and others quoted in this article, should not be thought of as a forecast but instead as an indication as to the potential risks and opportunities facing different companies and markets. They are also not a reflection of any country itself, only the companies listed on its stock market.

So what’s behind the Spanish market’s strong showing? Its large utilities and telecoms companies provide valuable services for society. For example, utilities provide clean water, sewerage and sanitation – lack of safe water, sanitation and adequate hygiene contribute to the leading killers of children under five, including diarrhoeal diseases, pneumonia, neonatal disorders and undernutrition. Companies obviously generate income from those services, but their pricing is capped well below the social value. Some utilities also have a big negative effect on the environment – and the Spanish market is only 7th best on this front – although this varies considerably from company to company.
But it’s not just the Spanish market’s big companies which drive its strong credentials. It’s also in second place for the median company.
A strong showing from the German and Danish stock markets
There are only a handful of other stock markets whose companies’ net externalities are positive, according to our analysis.
The Danish market is worth highlighting. Not only does it come third when all of the net externalities from all of its companies are aggregated, it is also in first place for its median company. And it is the only market for which we assess its companies, in aggregate, to have a net positive effect on the environment. This latter point is largely driven by the presence of the large wind turbine manufacturer, Vestas.
Unlike Spain, however, the Danish stock market scores relatively poorly on the social front (18/20). Alcoholic drinks company Carlsberg is the main culprit.
While studies vary, most show that costs associated with health and crime comprise around half the total arising from alcohol consumption, with indirect costs linked to unemployment, absenteeism and productivity accounting for the rest. Most studies also indicate that binge drinking is the dominant source of costs, rather than social drinking.
This highlights an important point. Many companies and markets score well for one of the E, S, or G in ESG but badly for another – Spain and Denmark, for example. Some investors may prefer to focus on environmental risks. Others on social ones. Complete alignment of views is unlikely to ever happen.
In the analysis presented here, we are not taking any moral stance on this point. It is financial analysis of the unrecognised financial risks to companies from the externalities they impose on or generate for society. It is an intentionally objective, not moralistic, approach.
The UK and Netherlands’ markets’ poor status masks many sustainable companies
At the other end of the chart are the UK and Dutch stock markets, both of which come out far worse than their nearest rival, India (Figure 2).
For both markets, the unrecognised costs of their listed companies’ activities amount to more than their profits. If these were to be crystallised as costs on their profit and loss statements, it would wipe out all profits, and then some. While not a forecast, this gives an indication of the potential risks to companies’ profitability.
But not all UK and Dutch companies are problematic
The reason why the UK stock market ranks so poorly is not, in fact, its well-known large allocation to the polluting energy and materials sectors (which combined make up 23% of the market at the end of July). Although that obviously doesn’t help. On environmental metrics, the UK comes in close to mid-table, in 12th place.
What really hurts is the market’s exposure to tobacco and alcoholic drinks companies. These have direct health and indirect societal costs. The Netherlands market also suffers from its exposure to alcoholic drinks companies.
What the markets’ poor scores in aggregate don’t tell you is that our analysis suggests around half of their listed companies have a positive, unrecognised, effect on society. There would be upside financial benefits if this was recognised and crystalized on their profit and loss statement.
In addition, the picture looks very different for UK small and mid-cap companies compared with large caps. Companies on the UK’s FTSE 250 index collectively have positive social externalities compared with the negative figure for UK large caps. They also cause less environmental damage. The story is rarely simple. While it brings additional insights, our league table is too blunt to be used in isolation to drive investment decisions.
How material are these externalities for corporate profits? Very
In many cases, corporate profits would take a severe hit if the financial impact of companies on the environment and society were borne by the companies behind them (Figure 2).
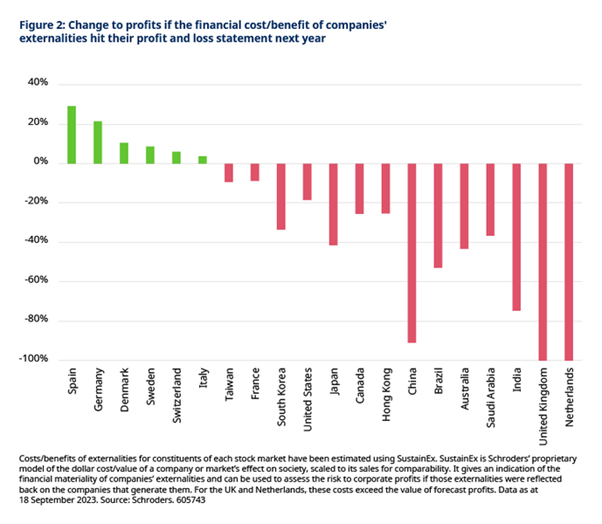
It may look odd for Chinese profits to be more at-risk than Saudi Arabian ones, when our league table shows that Saudi Arabian companies have a bigger negative effect on society. This is because the Chinese stock market has a relatively low forecast profit margin (4.7%) whereas the Saudi Arabian market has a relatively high one (21.0%). Chinese companies simply have less headroom from which to absorb any additional costs.
What should investors do?
As we’ve mentioned already, SustainEx and our league table provide additional insights on the risks and opportunities in different companies and stock markets but should not be used as the basis for buy or sell decisions. They are only one piece of a much bigger puzzle.
On the returns front, strong sustainability credentials don’t guarantee good returns, and vice-versa. It is important to assess how much of the opportunities and risks are already reflected in share prices. We have explored this topic here Why companies with stronger ESG credentials should be expected to underperform…but won’t and here: Are more sustainable companies more expensive? This is the role of active managers.
Some investors prioritise improving the sustainability credentials of their portfolio. Others on having a positive impact. A portfolio which excludes the markets of the worst offenders would obviously look far more beneficial to society than simply buying the broad global market. This is true whether we are looking at stock markets, sectors, or individual companies.
But that doesn’t mean it would be the right thing to do to achieve better outcomes for society. Or for investment returns.
Excluding certain companies or sectors doesn’t stop harmful activities taking place. For every seller of shares there is a buyer. And maybe that buyer doesn’t care as much about engaging with companies to encourage a transition away from more harmful activities – an activity we at Schroders put a lot of effort into.
We are firm believers in the power and importance of active ownership and have a depth of experience that enables us to identify the most effective ways to engage with the companies we invest in. This can drive better outcomes for society and better returns for shareholders (these are intrinsically linked, not mutually exclusive).
There are, of course, red lines. Where companies refuse to engage, or where their business model is so inextricably linked to harm that they are effectively a lost cause, then there may be no other option than to sell. It is part of our toolkit as active managers, but we believe this should be one of the last tools investors turn to, not the first.
More where this came from
We plan to update our sustainability stock market league table twice a year, including analysis of any major changes. We are also carrying out additional research to help you develop a deeper understanding of the sustainability characteristics of stock market investments, and their link with valuations and returns. Watch this space.
Important Information
For professional investors and advisers only. The material is not suitable for retail clients. We define “Professional Investors” as those who have the appropriate expertise and knowledge e.g. asset managers, distributors and financial intermediaries.
Any reference to sectors/countries/stocks/securities are for illustrative purposes only and not a recommendation to buy or sell any financial instrument/securities or adopt any investment strategy.
Reliance should not be placed on any views or information in the material when taking individual investment and/or strategic decisions.
Past Performance is not a guide to future performance and may not be repeated. The value of investments and the income from them may go down as well as up and investors may not get back the amounts originally invested. Exchange rate changes may cause the value of investments to fall as well as rise.
The views and opinions contained herein are those of the individuals to whom they are attributed and may not necessarily represent views expressed or reflected in other Schroders communications, strategies or funds.
Information herein is believed to be reliable but Schroders does not warrant its completeness or accuracy.
Issued in August 2023 by Schroders Investment Management Ltd registration number: 01893220 (Incorporated in England and Wales) which is authorised and regulated in the UK by the Financial Conduct Authority and an authorised financial services provider in South Africa FSP No: 48998
* SustainEx™ provides an estimate of the potential “externalities” that an issuer may create in terms of social and environmental “costs” or “benefits” of that issuer. It does this by using certain metrics with respect to that issuer, and quantifying them positively (for example by paying ‘fair wages’) and negatively (for example the carbon an issuer emits) to produce an aggregate notional measure of the relevant underlying issuer’s social and environmental “costs” or “externalities”. SustainEx™ utilises and is reliant on third party data (including third party estimates) as well as Schroders’ own modelling assumptions, and the outcome may differ from other sustainability tools and measures. Where SustainEx™ relies on data and estimates produced by third parties, Schroders seeks to ensure that such data and estimates are accurate, but Schroders cannot and does not warrant the accuracy, completeness and adequacy of such third-party data and estimates. Like any model, SustainEx™ will evolve and develop over time as Schroders continues to assess, refine and add to the metrics and their relative contributions. Generating SustainEx™ scores involves an element of judgment and subjectivity across the different metrics chosen by Schroders, and accordingly Schroders does not accept any liability arising from any inaccuracy or omission in, or the use of or reliance on, SustainEx™ scores. As the model evolves, changes made to how metrics are applied may result in changes to the SustainEx™ score of any issuer and ultimately the overall fund/portfolio score. At the same time, of course, the issuer’s SustainEx™ performance might improve or deteriorate.